Categories:
General Market Commentary
/
Precious Metals
Topics:
General Market Commentary
/
General Precious Metals
Precious Metals and Miners Soar in 2019
2019 marked the best performance for the precious metals complex in nearly a decade. Gold bullion closed the year at $1,517 (gaining 18.31% for the 12 months). Silver bullion ended the year at $17.85 (up 15.23% in 2019). Platinum climbed 21.56% in 2019, and palladium soared 54.24%. Gold mining equities showed notable strength, finishing 2019 up 43.49%.1
Month of December 2019
| Indicator | 12/31/19 | 11/30/19 | Change | % Chg | Analysis |
| Gold Bullion | $1,517 | $1,464 | $53.30 | 3.64% | Gold correction has ended; up leg resumes |
| Silver Bullion | $17.85 | $17.03 | $0.82 | 4.83% | Silver just shy of $18 level |
| Gold Equities (SGDM) 1 | $25.15 | $23.34 | $1.81 | 7.77% | Gold equities correction over; up leg resumes |
| Gold Equities (GDX) 2 | $29.28 | $27.08 | 2.20% | 8.12% | Ditto (above) |
| DXY US Dollar Index 3 | 96.39 | 98.27 | ($1.88) | (1.92)% | Down leg beginning |
| U.S. Treasury 10 YR Yield | 1.92% | 1.78% | 0.14% | 7.98% | Still below 2.04% resistance |
| German Bund 10 YR Yield | (0.19)% | (0.36)% | 0.18% | 47.22% | Testing resistance level |
| U.S. Treasury 10 YR Real Yield | 0.13% | 0.15% | ($0.02) | (13.33)% | No signs of turning higher |
| Total Negative Debt ($Trillion) | $11.30 | $12.40 | ($1.12) | (8.87)% | Trending in line with global yields |
| CFTC Gold Non-Comm Net Position 4 and ETFs (Millions of Oz) | 113.65 | 111.16 | 2.49 | 2.24% | Still near all-time high levels; no signs of selling |
After consolidating for the past four months, gold bullion broke out of its corrective range in the last few days of December due to a combination of factors, with U.S. dollar weakness being the most prominent. Yields remain rangebound at the lower-end despite the favorable resolution of the U.S.-China Phase One Trade Deal and renewed hope for a reflationary market. Equity markets overall continued their ramp up into year-end backed by the massive expansion in the U.S. Federal Reserve’s ("U.S. Fed") balance sheet.
Gold Bullion Breaks Through Resistance Level of $1,500
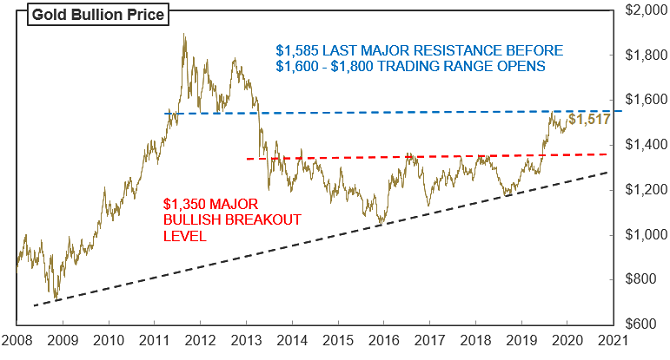
Gold ended its short-term corrective phase in December by breaking above the $1,500 level. The early September 2019 highs of $1,557 are likely to be re-tested. The last significant resistance remains in the neighborhood of $1,587 (the 61.8% retracement of the 2011 peak to 2015 lows and major chart resistance). Once this level is surpassed, the $1,600 to $1,800 trading range for gold will become open.
What stands out in this correction is the surprising resilience of the CFTC positions.4 CFTC positioning has been dominated by quant funds/CTAs,5 which are model-driven. They began the year by adding, had a selling leg into April, bought aggressively in May and June and have held steady since then. Despite all the noise in the past few months, their models remain positive on gold.
Figure 1. Gold Bullion Likely to Test the Last Major Overhead Resistance Level

Source: Bloomberg as of December 31, 2019.
Gold Equities Continue to Climb
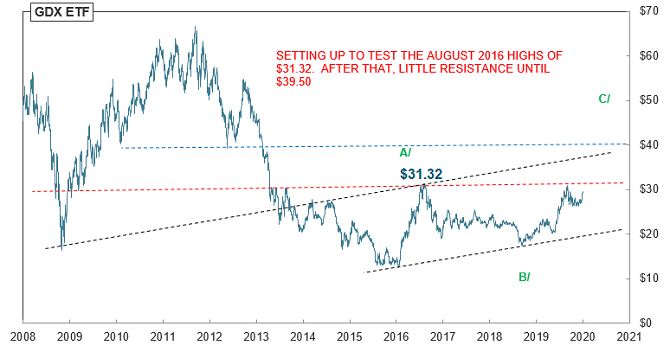
GDX, a measure of gold mining equities performance, held the $26 level convincingly during the correction and has now broken out above $28. As the price kept approaching the $26 level, selling pressure kept fading as there were no real sellers. Through the $28 breakout, we saw the opposite as buying pressure increased — a positive sign. We are nearing two significant highs: the September 2019 closing high of $30.95 and the August 2016 closing high of $31.32. Surpassing the $30.95 level will set up a cup-and-handle breakout to target the $36 level, well beyond the $31.32 high. We then see little resistance until the $39.35 level. The 50% Fibonacci retracement of the entire 2011 to 2016 bear market is at $39.55. On a successful breakout, $39.50 is the next target level for GDX.
Figure 2. GDX Likely to Test Critical August 2016 Highs of $31.32
A breakout will establish a large multi-year bullish base pattern, and there will be little resistance until the $39.50 level.

Source: Bloomberg as of December 31, 2019.
Outlook for Interest Rates
Currently, the consensus view for interest rates is higher, with about 70 interest rate cuts globally in 2019. Given the U.S.-China trade deal, the reflation narrative is back as the market expectation is for an economic reacceleration. We believe there will be a lift in the economic outlook, though it will likely be less than current expectations. We are at the very late stages of this expansion cycle, which is already the longest in U.S. history at 125 months (bottom at June 2009).
On January 15, Trump is expected to sign the U.S.-China Phase One Trade Deal agreement. Phase Two talks will be much more contentious and complicated, involving intellectual property, technology transfers and capital investments. Not much capital investment related to trade will be committed by businesses without Phase Two completed. For perspective, the reflation trade has not occurred in the past decade beyond a short-lived trading action. Despite massive amounts of QE (quantitative easing) programs, fiscal stimulus, enormous debt, record low interest rates and other measures, growth has been weak and inconsistent for a reflationary capital market. We don’t see how the events of the past few months will change this outlook except for the market sentiment.